
96%+ auto-classification
AI-based categorization against a standard taxonomy, with manual override where needed.
Automated classification, category benchmarks and inflation-adjusted trends turn scattered transaction data into decisions your team can act on this quarter.
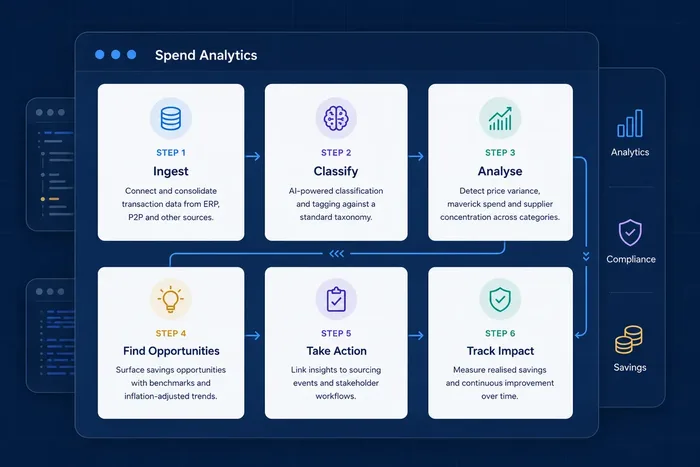
AI-based categorization against a standard taxonomy, with manual override where needed.
Off-contract and non-preferred-supplier spend flagged automatically, category by category.
Consolidated view across ERPs, business units and regions in one normalized model.
Category cost trends adjusted for market inflation, so savings are measured accurately.
Connects to ERP and P2P transaction data - no manual spreadsheet consolidation.
A standard, extensible taxonomy applied consistently across business units.
Flags the same item or service purchased at different prices across suppliers or entities.
Understand single-source risk and consolidation opportunities by category.
Role-specific views for CPOs, category managers and finance stakeholders.
Ties identified opportunities to sourcing events and tracks realized savings over time.
The traditional answer to spend visibility is a periodic exercise: extract from each ERP, consolidate, classify, and produce a view that is accurate on the day it is built and decaying from the day after. It is a project, it is repeated quarterly, and by the time it is finished the questions that prompted it have moved on.
Classification quality is where these efforts usually fail. Spend that is miscategorised is not merely imprecise; it is invisible to the strategy that depends on it. Consolidation opportunities disappear because the same item sits under three category codes across two entities. This is why spend visibility work routinely surfaces immediate savings before any negotiation takes place. The value is in seeing volume that was always there.
Continuous automated classification against a standard taxonomy, with manual override where the machine is wrong, changes it from a project into a state. Off-contract and non-preferred-supplier spend is flagged as it occurs rather than discovered in a review, and the view spans entities and ERPs rather than one at a time.
Analytics is the input to category strategy, not a substitute for it. A spend view tells you where the money goes; deciding what to do about it is the work described in our guide to classifying categories with the Kraljic Matrix.
Who uses it. Category managers looking for consolidation, the CPO deciding where to deploy scarce sourcing capacity, and finance reconciling procurement's view of spend with the ledger's.
What it connects to. Transaction data from one or more ERPs, the supplier master, and contract coverage - so off-contract spend is identifiable rather than inferred. Opportunities flow into cost optimization and, from there, into sourcing events.
What it does not do. Classification is never perfect, and a taxonomy that nobody owns degrades. The override path matters as much as the automation: the value comes from a classification the category owners believe, not from the highest possible auto-match rate.
Analytics on your own categories - or estimate your savings with the ROI calculator.